
Is the Crypto Bull Run Over?
Updated June 2026 · Educational market context, not financial advice
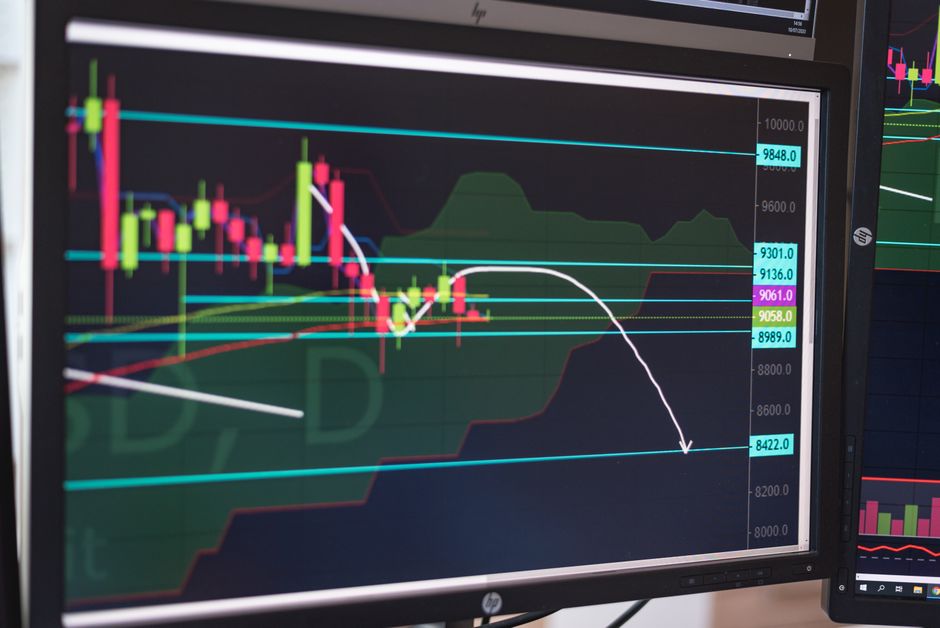
You've already checked the price today. Probably twice. Bitcoin's down, your portfolio looks like a ski slope, and the guy in your group chat who was screaming "we're so back" a few weeks ago has gone very quiet.
So here you are, asking what everyone asks at this exact point in the cycle: is the bull run over? Or the quieter version: should I just sell and make it stop?
We can't tell you what to do — legally, we can't. What we can say is that the feeling you've got right now has a long history. It shows up in rough patches all over crypto's chart, sometimes near the lows and sometimes right before things got worse. That's the problem with panic as a signal: it feels identical whether you're early or about to be very wrong. Markets aren't usually lost on bad analysis. They're lost on feelings. So rather than try to time the top — which, historically, no method has reliably done in advance — let's get you reading the crypto market cycle well enough to keep your head while everyone else loses theirs. All of this is educational context, not a prediction, not a trading signal, not advice.
What does it actually mean for a bull run to be "over"?
Worth agreeing on what we're even asking. A crypto bull run is the markup phase of the cycle: a sustained uptrend of higher highs and higher lows, rising optimism, and the unmistakable moment your uncle asks you about Bitcoin at dinner. It isn't "over" because price had a rough week and your stomach hurts. It's over when the structure breaks. The uptrend rolls into a sustained downtrend, momentum leaks out, and the mood slides from euphoria into denial, then distribution, then a full bear market.
The reason this question is so hard to answer in the moment: some past crypto bull markets included savage corrections that felt exactly like the end, and with hindsight weren't. (Past corrections don't predict future recoveries, to be clear.) So "is the bull market over?" is really two questions in a trench coat. Has the cycle structurally turned, or is this a violent nap in the middle of an ongoing trend? In real time that's a tough call. After the fact it's obvious, which is why everyone on your timeline is a genius in hindsight.
Signs the cycle may be topping
No single signal rings a bell at the top — historically, none has reliably marked it in advance. But analysts tend to watch for a cluster of conditions that have shown up late in past bull runs:
- Euphoria peaks, then fizzles. The parabolic moves and record retail mania are still there, but price quietly stops making new highs while everyone's still giddy. That gap is classic distribution behavior.
- Higher highs turn into lower highs. The defining structural change. The market stops printing new peaks and starts printing lower ones.
- Market quality quietly weakens. Price can hold up on the surface even as the broader conditions underneath it soften — something often seen before late-cycle downturns.
- The crowd gets confident. Tops tend to be built on confidence, not fear. One-way "it only goes up" conviction has shown up in some late-cycle markets, though sentiment alone is never a timing signal.
Signs it's a mid-cycle dip, not the end
The flip side. A few things suggest a brutal pullback is a correction inside a bull run rather than the start of a bear market:
- The bigger uptrend is intact. On longer timeframes the market is still making higher lows, even when the daily candles are giving everyone a heart attack.
- Sentiment has flipped to real fear. In some past cycles, sharp dips that washed out optimism and triggered "is crypto crashing?!" panic came before later recoveries. In other cases they came before deeper declines. So treat sentiment as context, not a timing signal.
- It's early in the four-year cycle. Some analyses line cycle phases up against Bitcoin halving dates, with tops in past cycles forming roughly a year after. The timing has varied a lot, and plenty of people think that rhythm has been stretched or broken by ETFs and institutional money, so it may not hold going forward.
So, is the crypto bull run over?
This is the part where you might expect a confident yes or no with an arrow pointing at a chart. We won't, because in real time that answer can't be more than a guess. Whenever you're asking this question, the honest truth is the same: a cycle top can only be confirmed after the fact. In the moment there's always a debate — some analysts point at the latest pullback and other market context and call it a top, others insist the old four-year cycle is dead and buried, and both camps are mostly backward-looking and change with the wind. That fog is exactly where reacting to every headline does the most damage to your sanity, and usually your timing. So the useful move isn't to pick a side. It's to learn to read the structure for yourself.
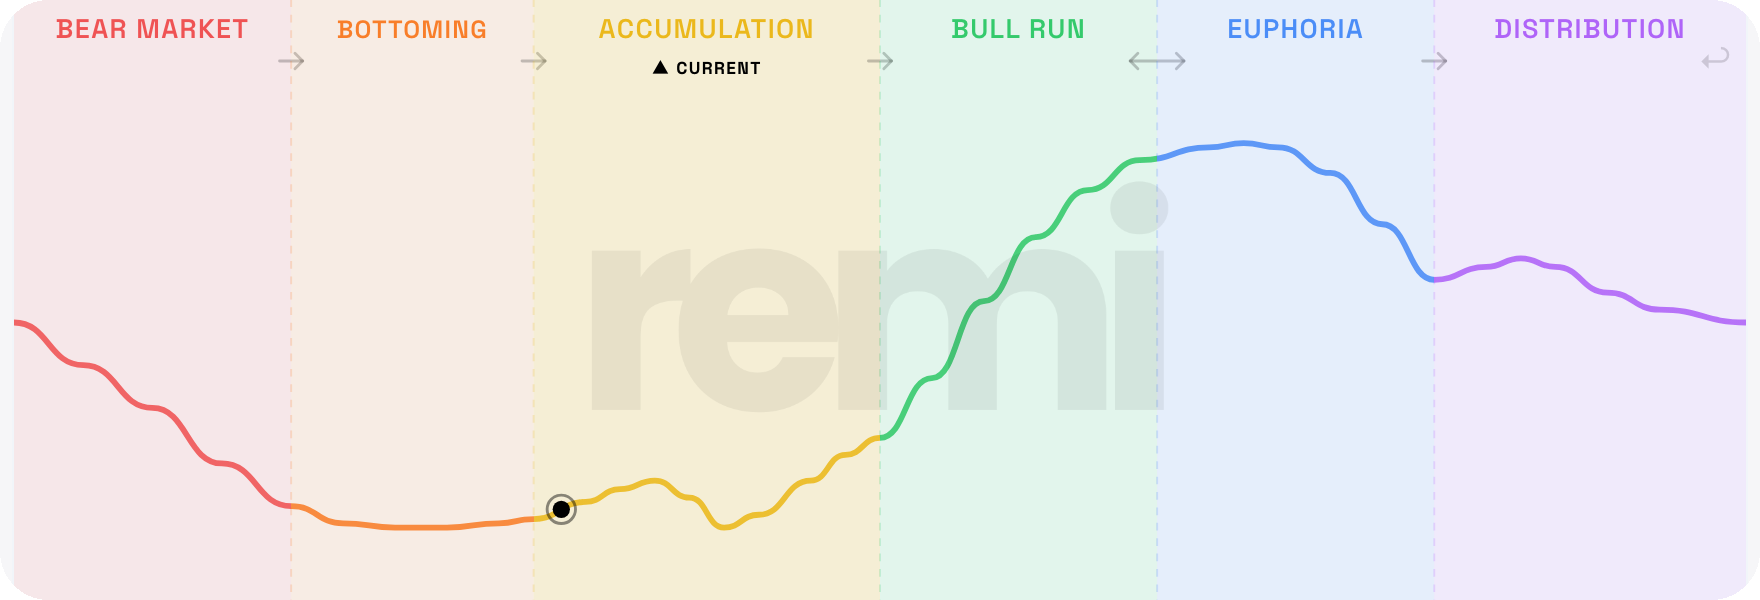
For educational context, the REMI Crypto Cycle Index is built to work like a super indicator: instead of leaving you to juggle a dozen separate charts and signals, it melts a range of market indicators down into one readable read on the cycle. It shows that as one model of current market conditions across six phase labels: Bottoming, Accumulation, Bull Run, Euphoria, Distribution, and Bear Market. It tracks the market live and updates daily, so the read progresses as the cycle itself progresses rather than sitting frozen on the day someone published a chart. Positive readings may reflect stronger market conditions, negative readings may reflect weaker or risk-off conditions. It is not a signal to buy, sell, hold, or time any asset, just one way to organize your own research.
How to read all this without losing your mind
The people who get chewed up by cycles mostly aren't the ones with bad spreadsheets. They're the ones refreshing the chart at 2am, making decisions with the part of the brain that also panic-texts an ex. A calmer, more educational approach tends to look like this: zoom out to longer timeframes instead of inhaling five-minute candles, treat sentiment extremes as context rather than commands, and figure out your own risk tolerance on a quiet day, not in the middle of a red one. A cycle framework is just a structured way to organize your own research and keep some perspective. It's educational context, not a nudge to do anything in particular.
One super indicator for the whole cycle
REMI melts a range of market indicators into one educational read on the cycle, across six phase labels. No hype, no price targets. Set up a free account and REMI can email you when the cycle phase changes, so you can step away from the chart instead of watching it.
View the Crypto Cycle Index →Educational only. Not a trading signal or a recommendation to buy, sell, or hold.
Common questions
Is the crypto bull market over right now?
Nobody can confirm a cycle top in real time. It's only obvious afterward, which is annoying but true. At any given moment the four-year-cycle debate is usually unresolved and the signals are mixed, which is exactly why a single yes/no call tends to be a guess. For a live, educational read on where the market sits today, the REMI Cycle Index maps current conditions onto six phases — a structured way to organize your own research, rather than a market call.
How long do crypto bull runs usually last?
In some past cycles, bull phases ran for roughly a year or more after a Bitcoin halving before topping, though the timing has varied widely and past patterns don't predict future results. A fair few people think the old rhythm is changing.
What comes after a bull run ends?
In cycle theory, a bull run may be followed by distribution, then a bear-market phase, and eventually bottoming conditions — before the cycle eventually turns toward the next bull run. No recovery is guaranteed for any asset or timeframe. You can see all six phase labels on the REMI Cycle Index.
Not financial advice
REMI is an educational market-intelligence tool. Nothing on this page is investment, financial, legal, or tax advice, and nothing here is a recommendation to buy, sell, or hold any asset. Use REMI as educational market context, not as personalized financial advice. Cryptocurrency is highly volatile and carries significant risk, including the risk of total loss — always do your own research and consider speaking with a licensed professional before making any decision.
Hero image by AlphaTradeZone on Pexels.
Last updated: June 2026 · Cycle Index · Privacy · Terms